Understanding key revenue metrics is vital for thriving in today’s fast-paced sales world. These metrics not only reveal your performance but also guide strategic decisions that drive growth.
In this blog, we’ll explore the total revenue formula and essential sales metrics every sales rep should know, complete with actionable tips and real-world examples.
Definition and Formula for Total Revenue
Total revenue represents the income earned from selling goods or services, offering a clear measure of a company’s financial performance.
The formula is simple:
Total Revenue = Price per Unit × Number of Units Sold
This equation helps businesses evaluate sales performance and make informed decisions about pricing and production strategies.
What are the most important sales metrics?
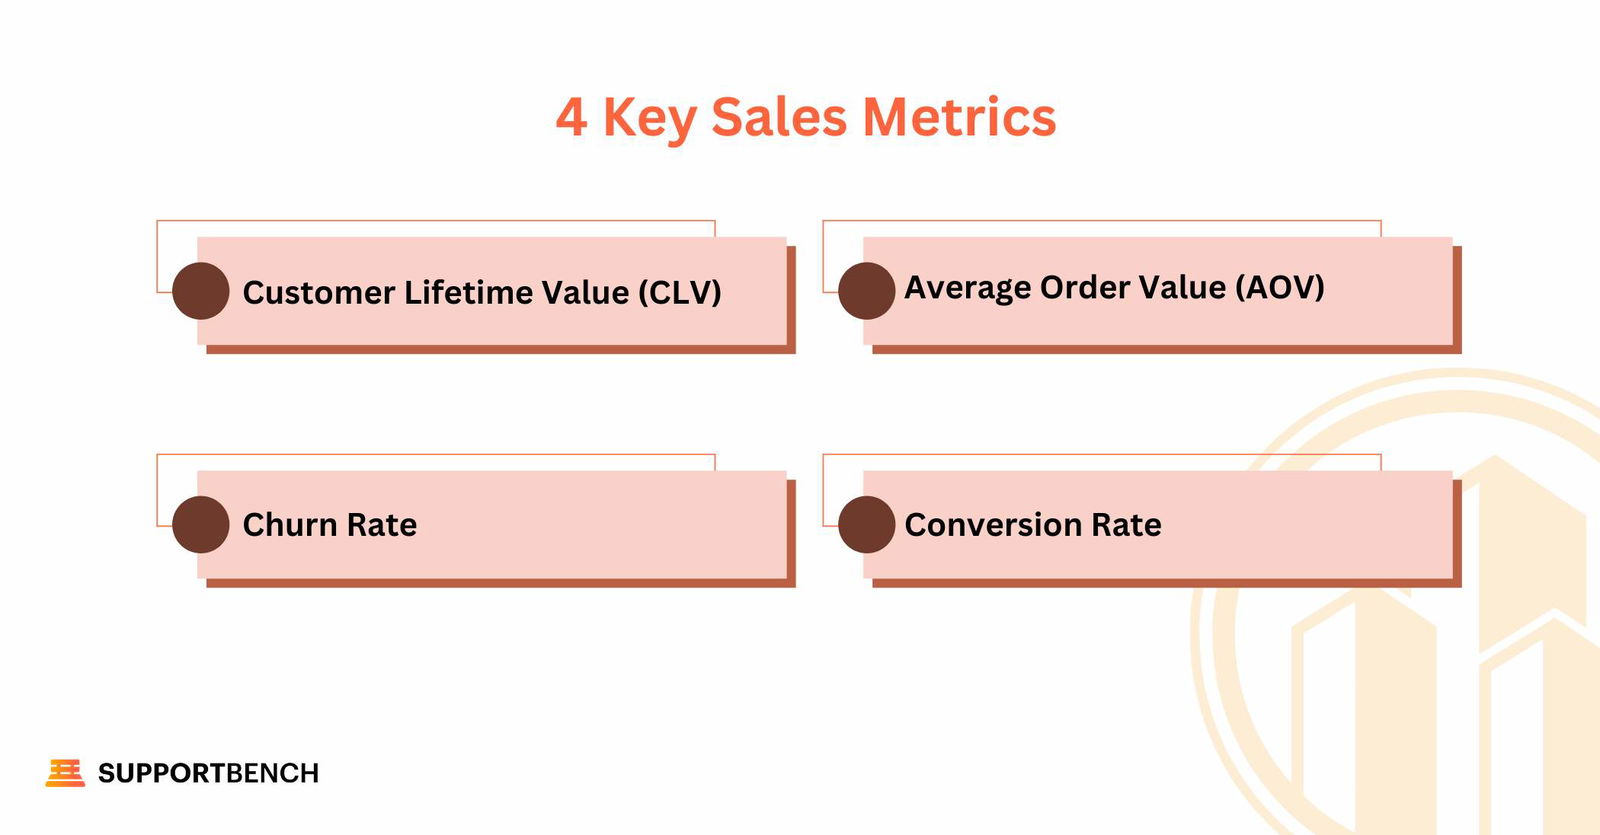
Tracking the right sales metrics is critical for understanding performance and driving growth. Below are four essential sales metrics, their formulas, and why they matter.

Customer Lifetime Value (CLV)
Definition: CLV estimates the total revenue a business can expect from a single customer throughout their relationship.
Formula:
CLV = ((Average Purchase Value × Purchase Frequency) / Customer Churn Rate) × Average Customer Lifespan
Importance: CLV helps prioritize customer retention and shape marketing strategies to maximize long-term profitability. Businesses that focus on high CLV customers often achieve sustained growth.
Average Order Value (AOV)
Definition: AOV measures the average amount spent per customer order.
Formula:
AOV = Total Revenue / Number of Orders
Importance: Understanding AOV enables businesses to analyze purchasing behaviour and implement upselling or cross-selling strategies to increase revenue per customer.
Churn Rate
Definition: Churn rate represents the percentage of customers who stop doing business with a company over a specific period.
Formula:
Churn Rate = (Number of Customers Lost / Total Customers at the Start of the Period) × 100
Importance: High churn rates signal customer dissatisfaction or ineffective retention strategies. Reducing churn is essential for improving CLV and sustaining business growth.
Conversion Rate
Definition: Conversion rate measures the percentage of leads or prospects that convert into paying customers.
Formula:
Conversion Rate = (Number of Sales / Number of Leads) × 100
Importance: A high conversion rate indicates effective sales tactics and marketing strategies, helping businesses optimize their sales funnels and increase revenue.
Importance of These Metrics in Sales Strategy
Understanding and tracking these metrics provides sales reps with actionable insights to enhance performance. Each metric highlights critical areas of the sales process, enabling data-driven decisions that lead to sustained growth.
By regularly monitoring these metrics, sales reps can:
- Identify strengths and weaknesses: Pinpoint areas of success and improvement in sales processes to refine strategies.
- Develop targeted strategies: Enhance customer acquisition efforts and implement effective retention plans tailored to maximize long-term value.
- Optimize pricing and marketing tactics: Adjust sales approaches, pricing models, and marketing strategies to align with revenue goals and customer behaviour.
Tracking these metrics consistently ensures that sales strategies remain agile and responsive to market demands.
Practical Examples and Tools for Calculating These Metrics
Understanding how to apply these metrics in real-world scenarios is crucial for optimizing sales strategies. Here are practical examples of how businesses use these metrics to drive success:
- Example 1: Leveraging CLV for Customer Retention
A software company tracks Customer Lifetime Value (CLV) to identify its most valuable customers. By offering these high-value customers exclusive perks, such as premium support or personalized offers, the company fosters loyalty and significantly reduces churn rates. - Example 2: Boosting Revenue with AOV Analysis
An e-commerce business analyzes Average Order Value (AOV) data to identify opportunities for cross-selling. By recommending complementary products during checkout, the store increases the average spend per customer and maximizes revenue.
Implementing these strategies requires not just tracking metrics but also interpreting the data to inform actionable decisions.

How Supportbench Simplifies Sales Metrics Tracking
Tracking sales metrics is crucial for understanding performance and achieving results. With the right tools, sales reps can gain actionable insights to refine strategies and drive revenue. Supportbench provides an all-in-one solution designed to simplify metric tracking and enhance decision-making.
Supportbench CRM: A Complete Solution for Tracking Metrics
Supportbench offers a powerful CRM platform tailored to help businesses measure and manage sales metrics efficiently. Key features include:
- Real-Time Dashboards: Access up-to-date metrics and make informed, data-driven decisions without switching between tools.
- Customizable Templates: Simplify reporting with templates that calculate total revenue, track sales growth, and analyze other essential figures.
- Time-Saving Features: Minimize manual calculations, allowing sales teams to focus on driving revenue and achieving their goals.
Supportbench Customizable Dashboards
One of Supportbench’s standout features is its customizable dashboards, which provide a comprehensive view of sales performance.
- Comprehensive Metrics Tracking: Monitor metrics like sales volume, churn rates, and quota attainment all in one place.
- Alignment with Goals: Tailor dashboards to specific objectives, whether it’s customer acquisition, retention, or revenue growth.
- Actionable Insights: Visualize key performance indicators, identify areas for improvement, and adjust strategies to optimize results.
With its intuitive tools, Supportbench empowers sales teams to make better decisions, streamline operations, and stay organized while driving success.
How can sales reps measure success?
Sales success isn’t just about meeting targets—it’s about tracking the right metrics and continuously improving performance. By focusing on key indicators, sales reps can evaluate their efficiency, customer engagement, and overall contribution to revenue growth.
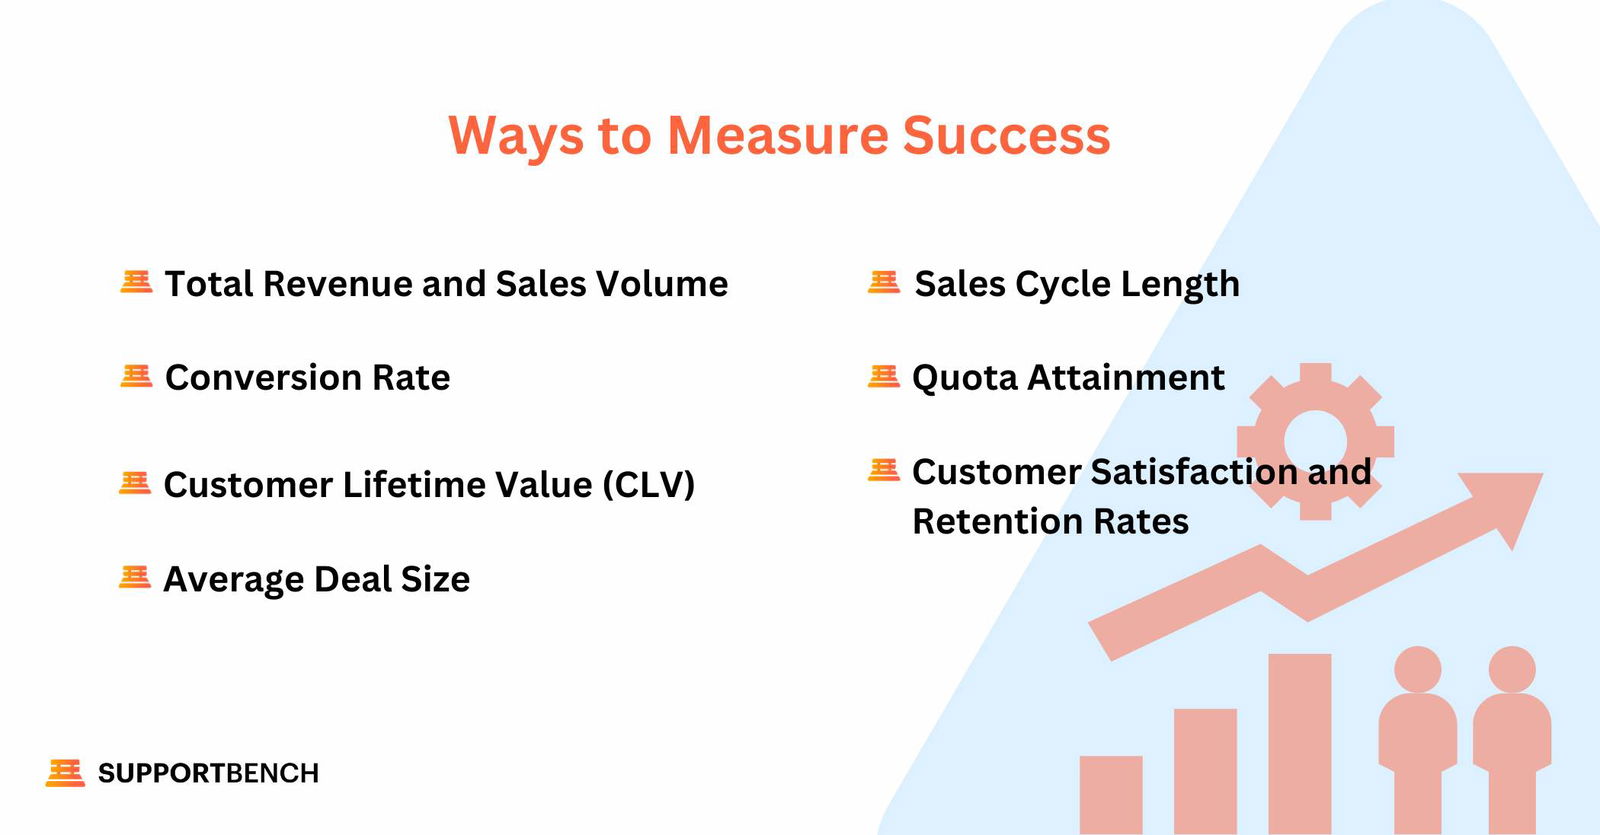
Here are the primary metrics sales reps can use to measure success:

Total Revenue and Sales Volume
The most straightforward way to gauge success is by tracking total revenue generated from sales. This metric highlights a sales rep’s contribution to the company’s financial growth and overall performance.
Conversion Rate
Conversion rate measures the percentage of leads or prospects that become paying customers. It’s a critical indicator of the effectiveness of sales tactics and the ability to close deals.
Formula:
Conversion Rate = (Number of Sales / Number of Leads) × 100
A high conversion rate reflects a strong product-market fit and persuasive sales strategies. Tracking this metric helps sales reps refine their approaches and target the right audience.
Customer Lifetime Value (CLV)
CLV represents the total revenue a business can expect from a customer throughout their relationship.
Formula:
CLV = Average Value of Sale × Number of Repeat Transactions × Average Retention Time
This metric is essential for understanding the long-term value of customer relationships. Sales reps with a focus on nurturing loyalty and repeat business can significantly boost their CLV.
Average Deal Size
Average deal size, or average order value, measures the revenue generated from each deal closed.
Formula:
Average Deal Size = Total Revenue / Number of Deals Closed
A higher average deal size often indicates effective upselling or cross-selling. This metric helps sales reps assess deal value and refine strategies for maximizing revenue per sale.

Sales Cycle Length
Sales cycle length tracks the time it takes from the initial contact with a prospect to closing the deal.
Shorter sales cycles often indicate efficiency and an ability to move prospects through the pipeline quickly. By monitoring this metric, sales reps can identify bottlenecks and streamline their processes to close deals faster.
Customer Satisfaction and Retention Rates
Customer satisfaction and retention are key indicators of a sales rep’s ability to build lasting relationships.
Formula:
Retention Rate = ((Customers at End of Period − New Customers Acquired) / Customers at Start of Period) × 100
High retention rates and customer satisfaction lead to repeat business and referrals, underscoring the importance of maintaining strong client relationships.
Quota Attainment
Meeting or exceeding sales quotas is a fundamental benchmark for success. Quotas are typically based on revenue or unit sales goals.
A high quota attainment percentage reflects a sales rep’s ability to meet company expectations, often leading to greater recognition and opportunities for career growth.
Conclusion
Tracking and improving critical sales metrics is key to driving business success. By adopting a data-driven approach, sales reps can make informed decisions, optimize strategies, and achieve their goals more efficiently.
Tools like Supportbench simplify this process, offering customizable dashboards and templates to streamline performance tracking. With the right resources, sales teams can stay organized, focus on what matters most, and consistently deliver results.


